How to use Unwrap.Fund
Unwrap.Fund shows what your portfolio really holds once every fund is opened up. This guide walks through the whole flow, from adding holdings to reading the report and trying what-if trades, using screenshots of the real tool.
- Add each stock, ETF or mutual fund you own, with its dollar amount.
- Press Unwrap.
- Read the report: your real company exposure, sectors, countries, fund overlap and fees.
Watch it first (about a minute)
Four holdings added, Unwrap pressed, one holding expanded to show which funds it comes from. It has a voice narration, and the steps are also shown on screen if you'd rather keep the sound off. The written steps and screenshots follow below.
1. Add your holdings
Open the tool. You don't need an account. The editor at the top is where everything starts.
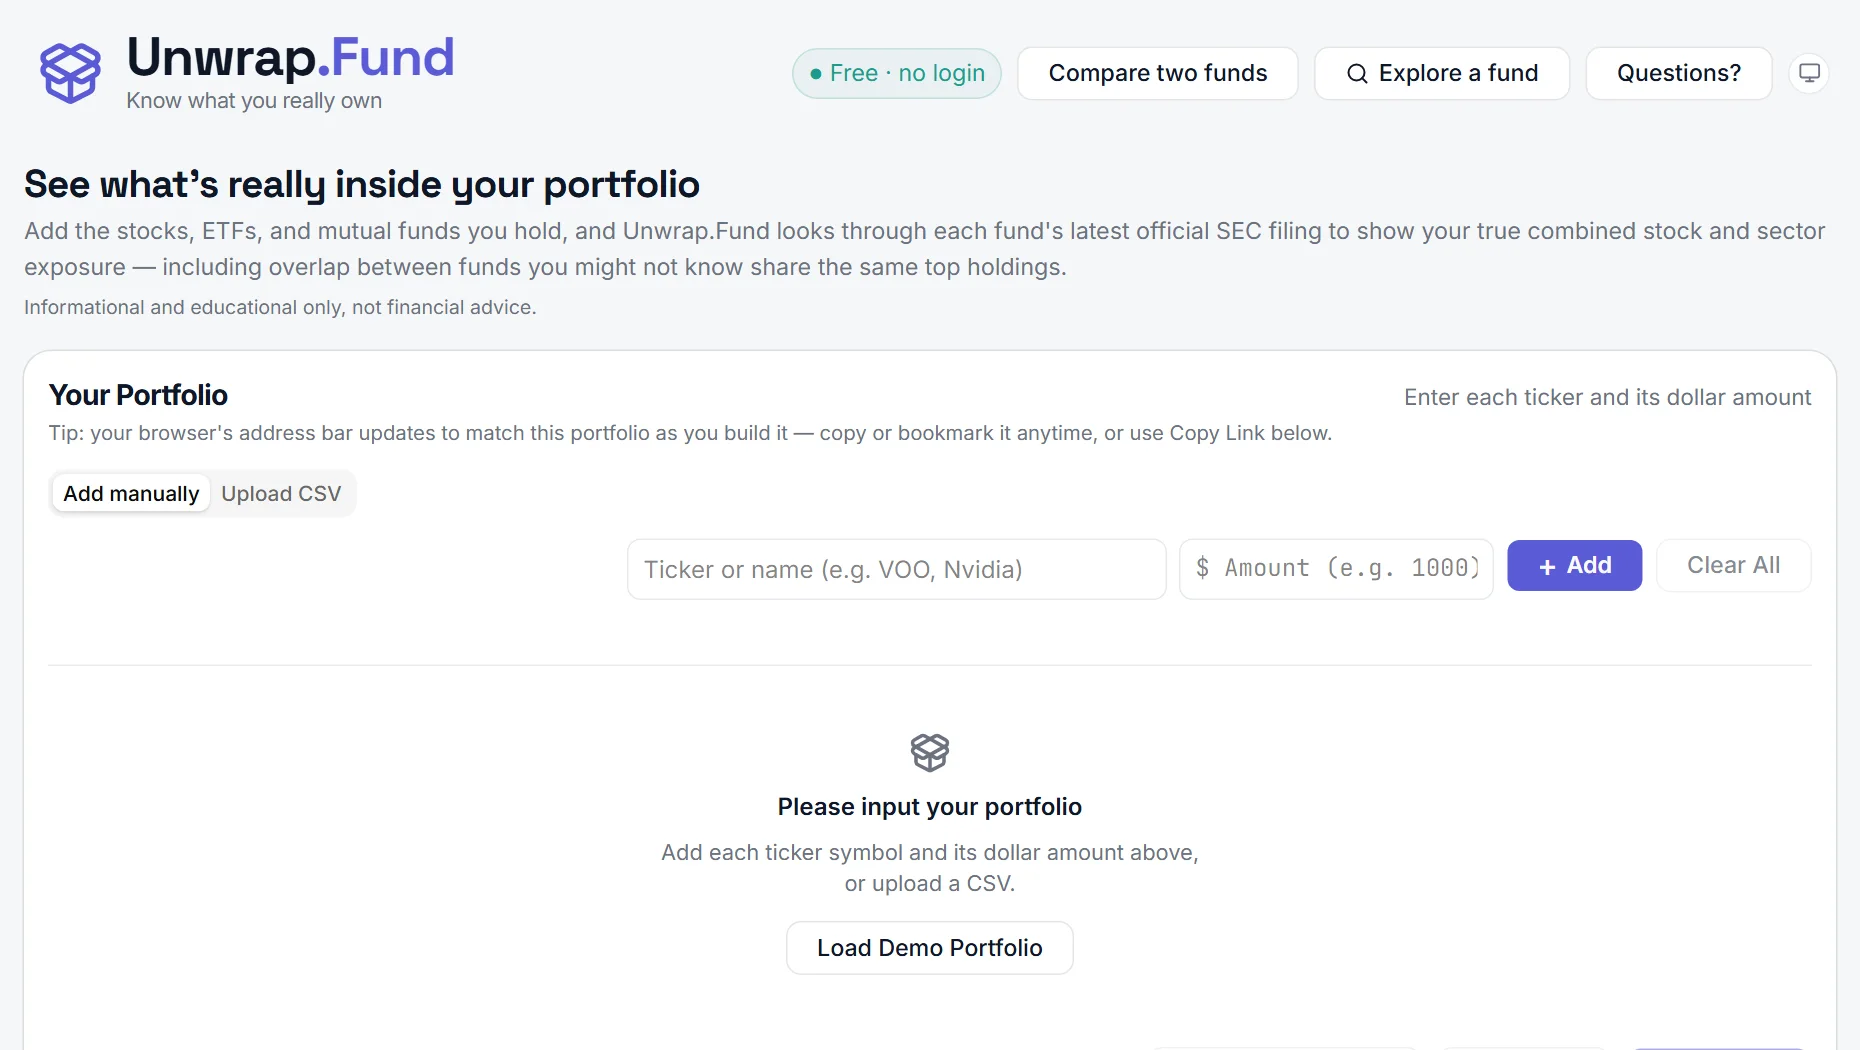
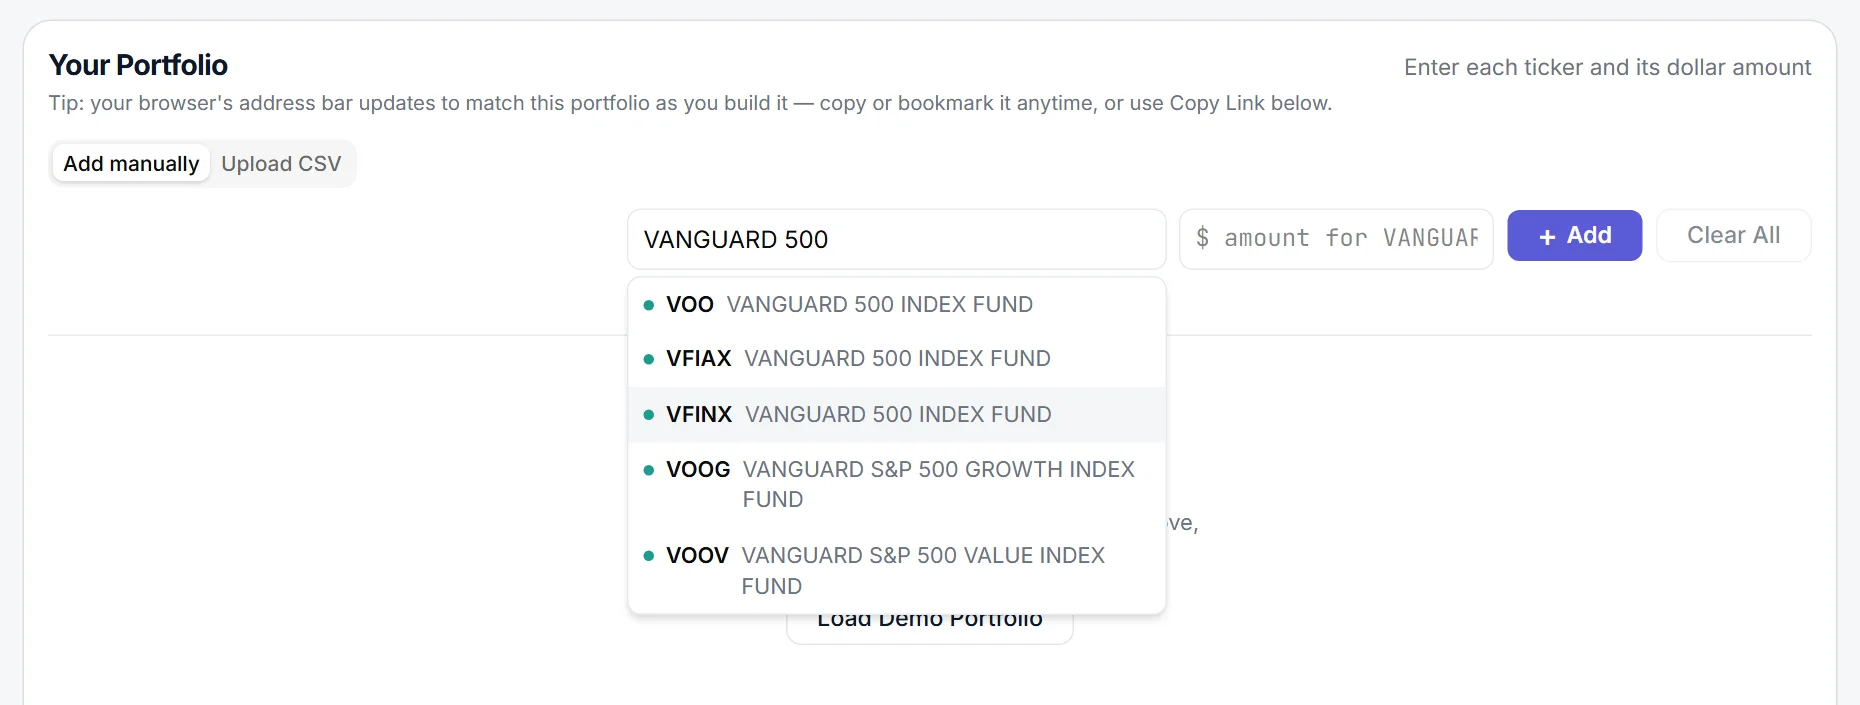
Enter a ticker such as VOO, or part of a name such as Vanguard 500 or Nvidia. Matching funds and stocks appear in a list; click one, or press Enter to take the top match.
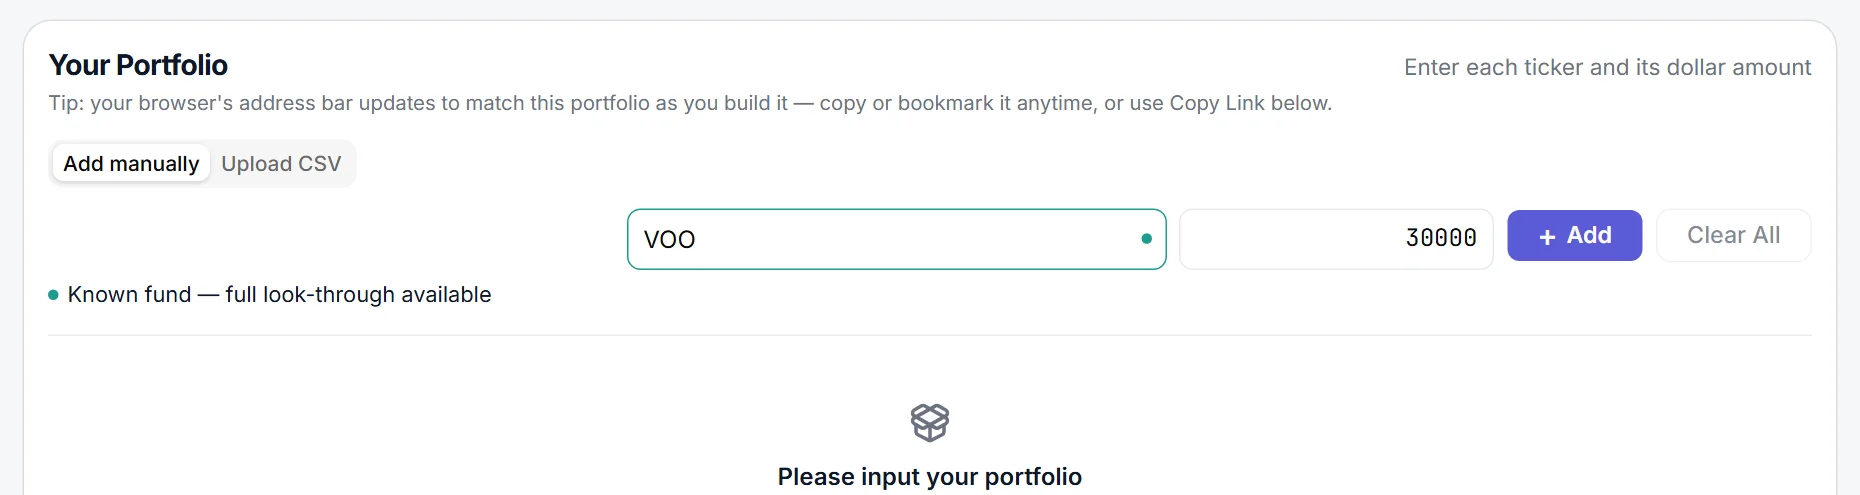
Type the dollar value of the position in the amount box, for example 30000.
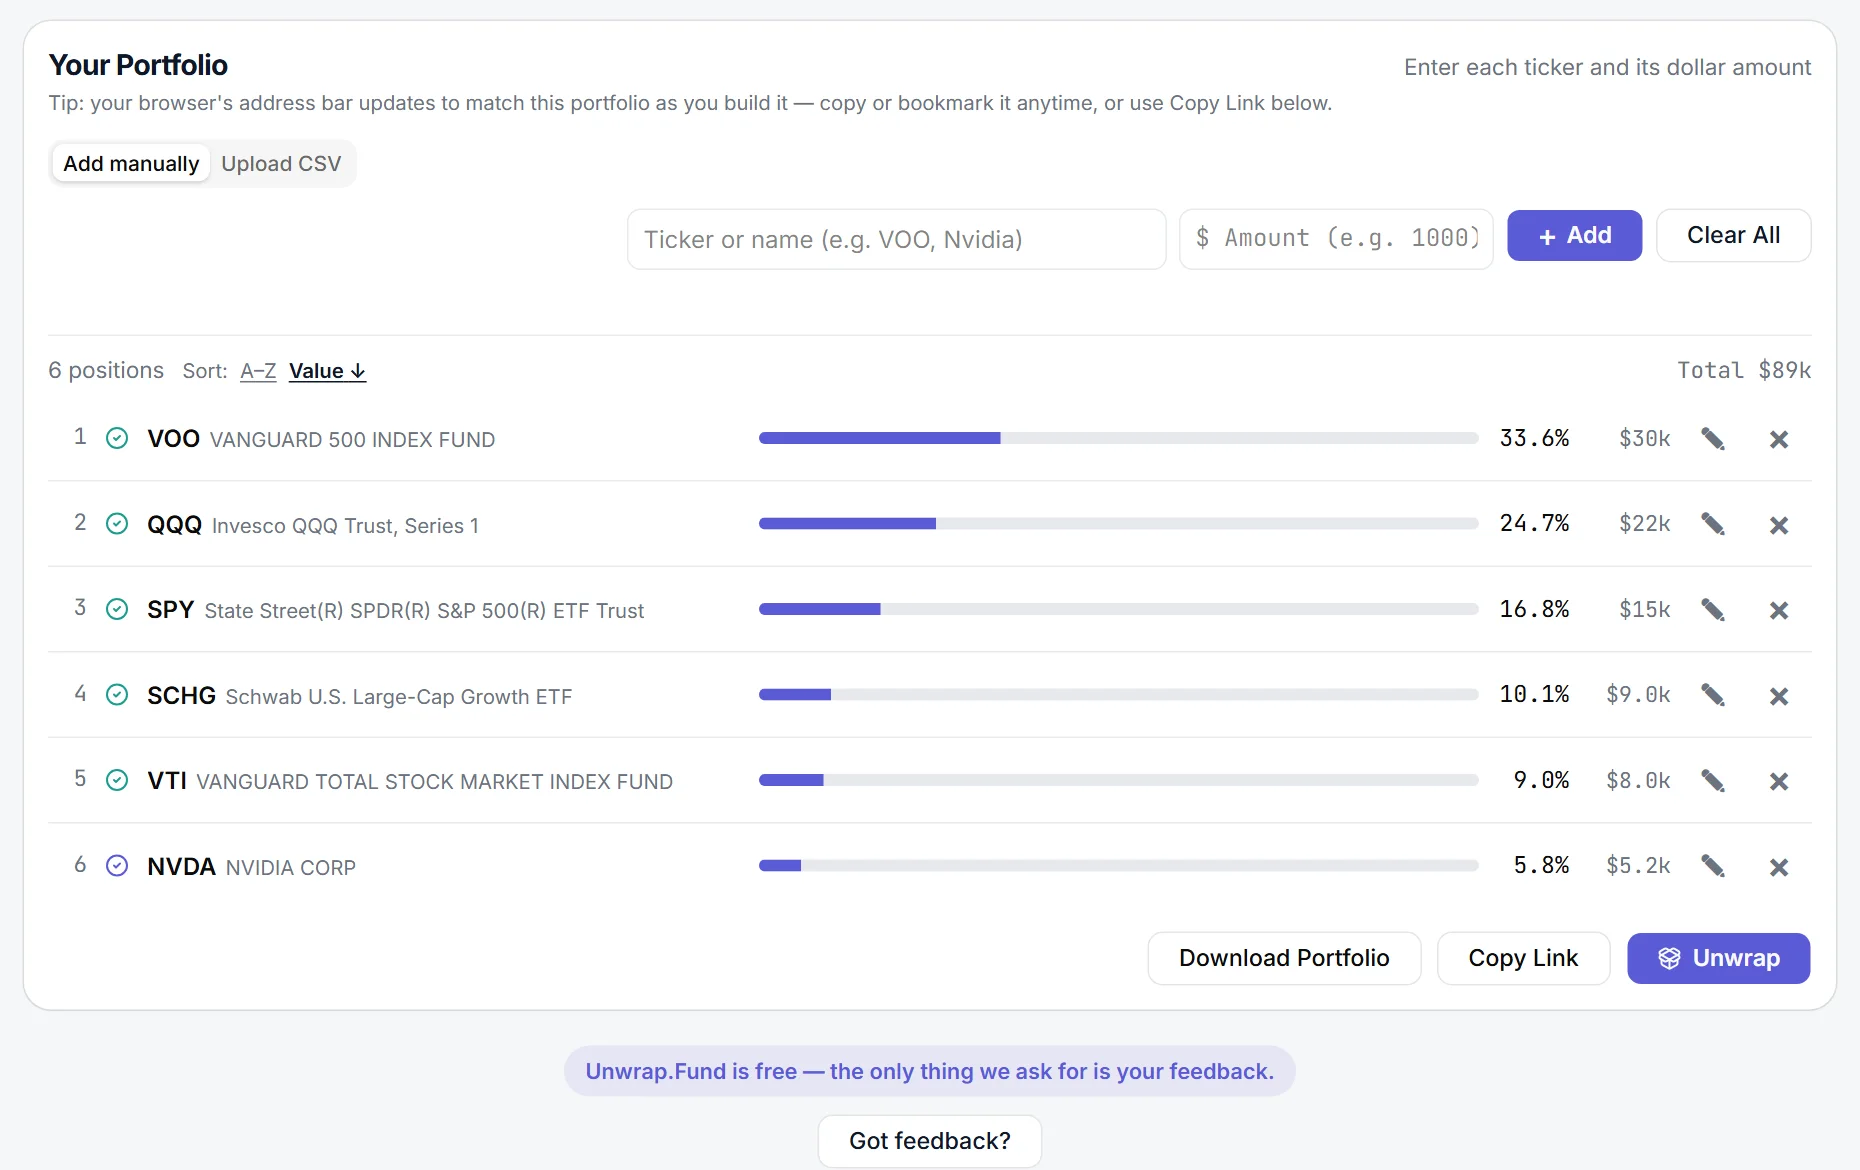
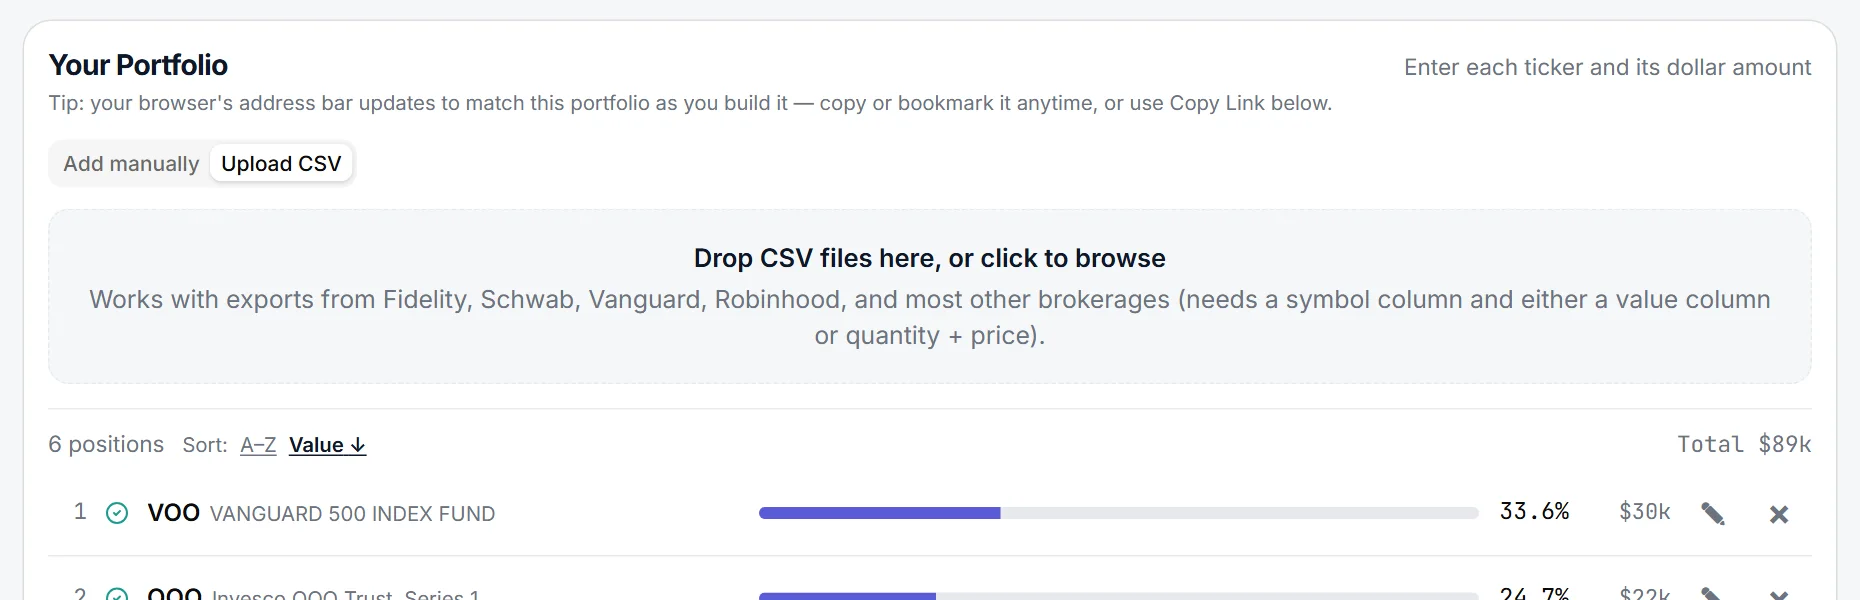
Each position joins the list with its weight shown as a bar. Use the pencil to change an amount, the X to remove a position, and the A–Z or Value links to re-sort. When you're done, the Unwrap button is at the bottom of the card.
Have a brokerage export?
Skip the typing: click the Upload CSV tab above the ticker box and drop in an export from Fidelity, Schwab, Vanguard, Robinhood or most others. The file needs a symbol column and either a value column or quantity plus price. Click Add manually to go back.
2. Press Unwrap
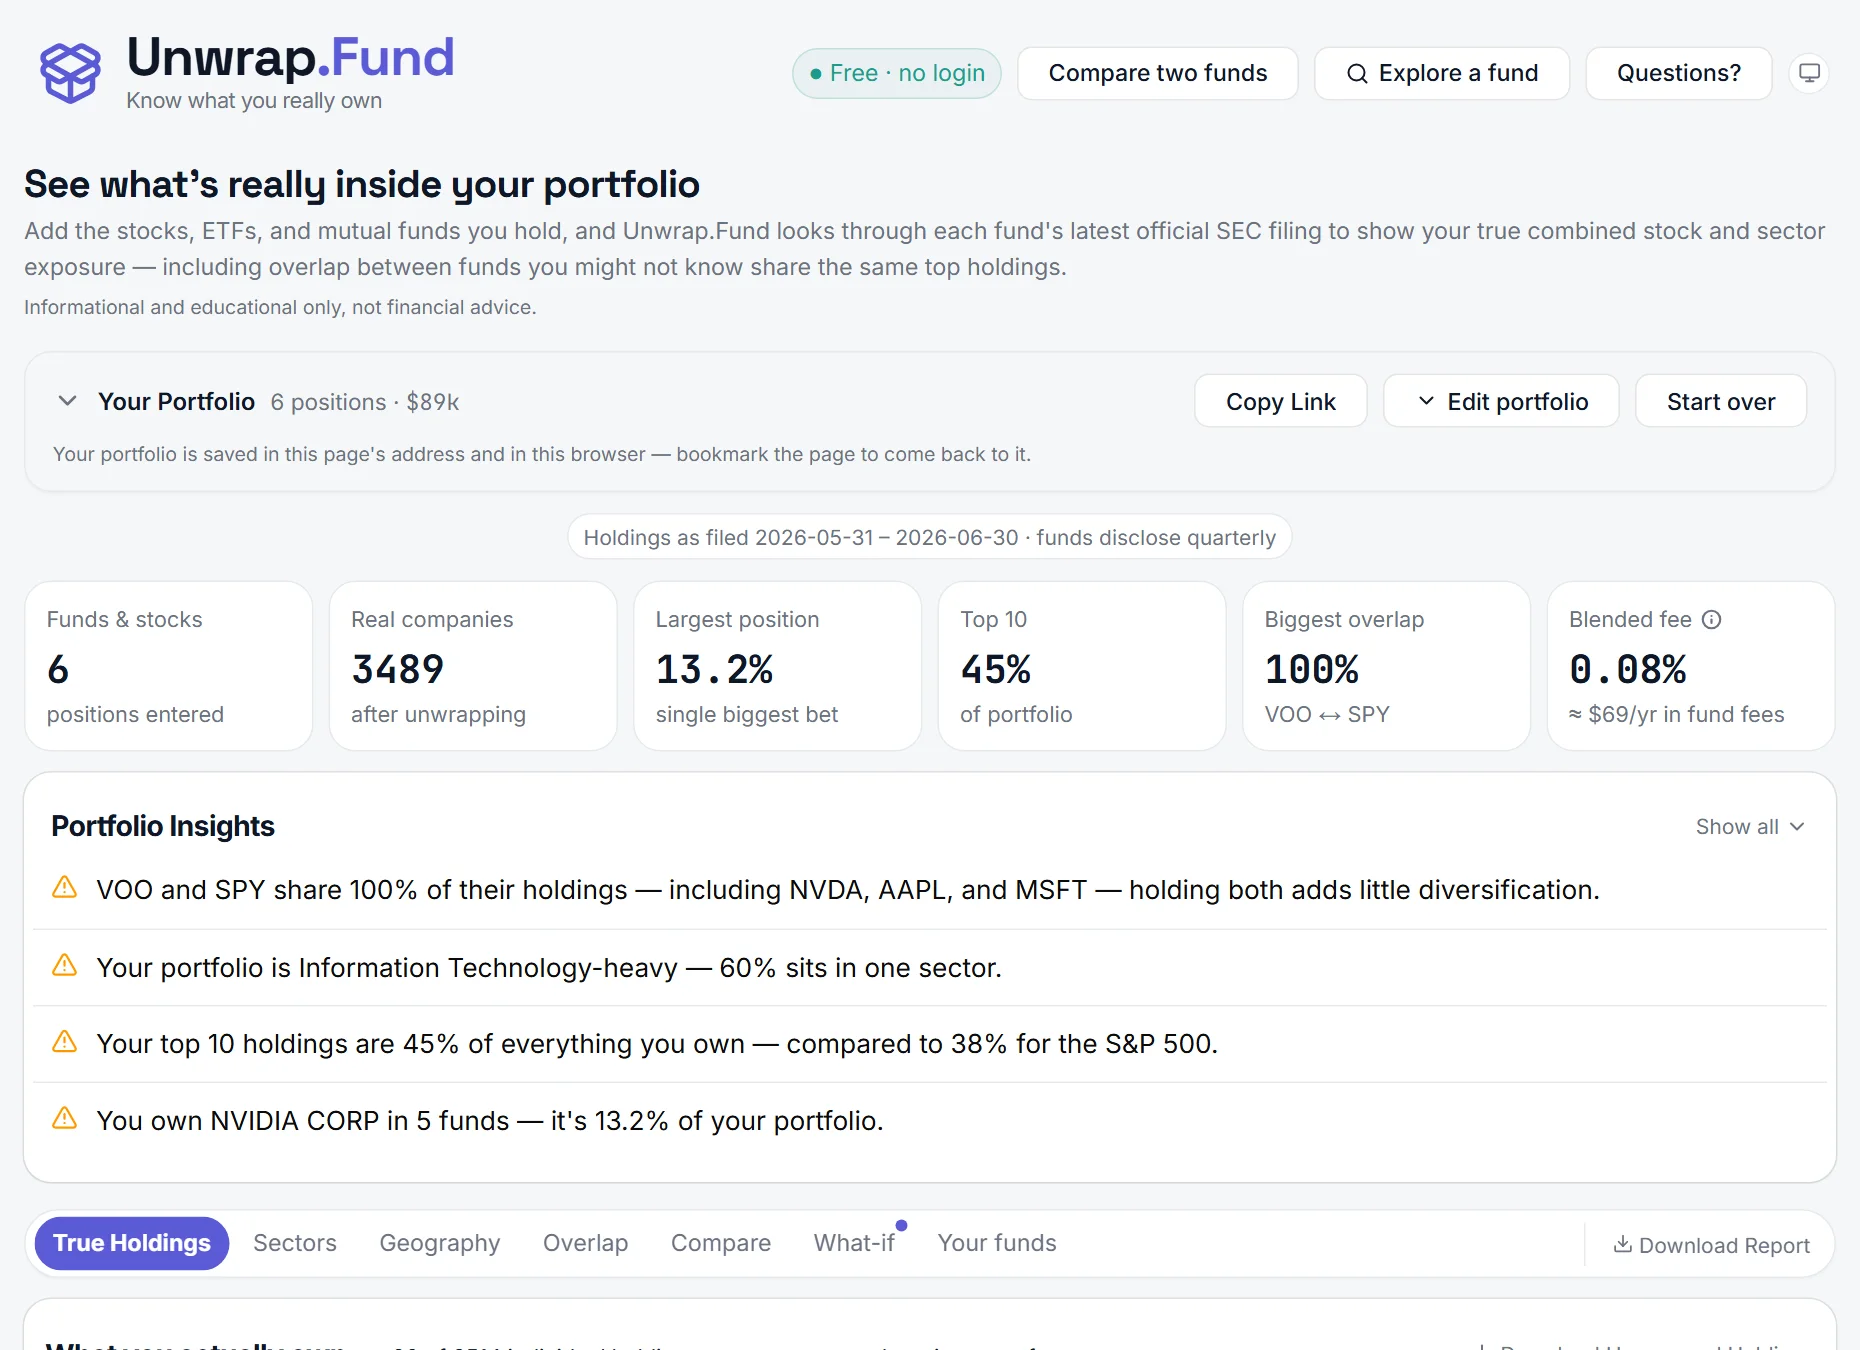
Click Unwrap. Unwrap.Fund opens each fund using its latest official SEC filing and adds everything up. Your list folds into a one-line summary and the report appears below it.
Reading the headline numbers:
- Funds & stocks is how many positions you entered, and Real companies is how many separate companies you own after every fund is opened up.
- Largest position and Top 10 show how concentrated you really are once overlap between your funds is counted.
- Biggest overlap names the two of your funds that share the most holdings.
- Blended fee is the weighted average expense ratio across your funds, with the yearly cost in dollars.
- Portfolio Insights turns the numbers into sentences, such as which stock you own through the most funds.
3. Read your report
The tabs under the headline numbers each show your portfolio from a different angle. Click through them in any order.
True Holdings
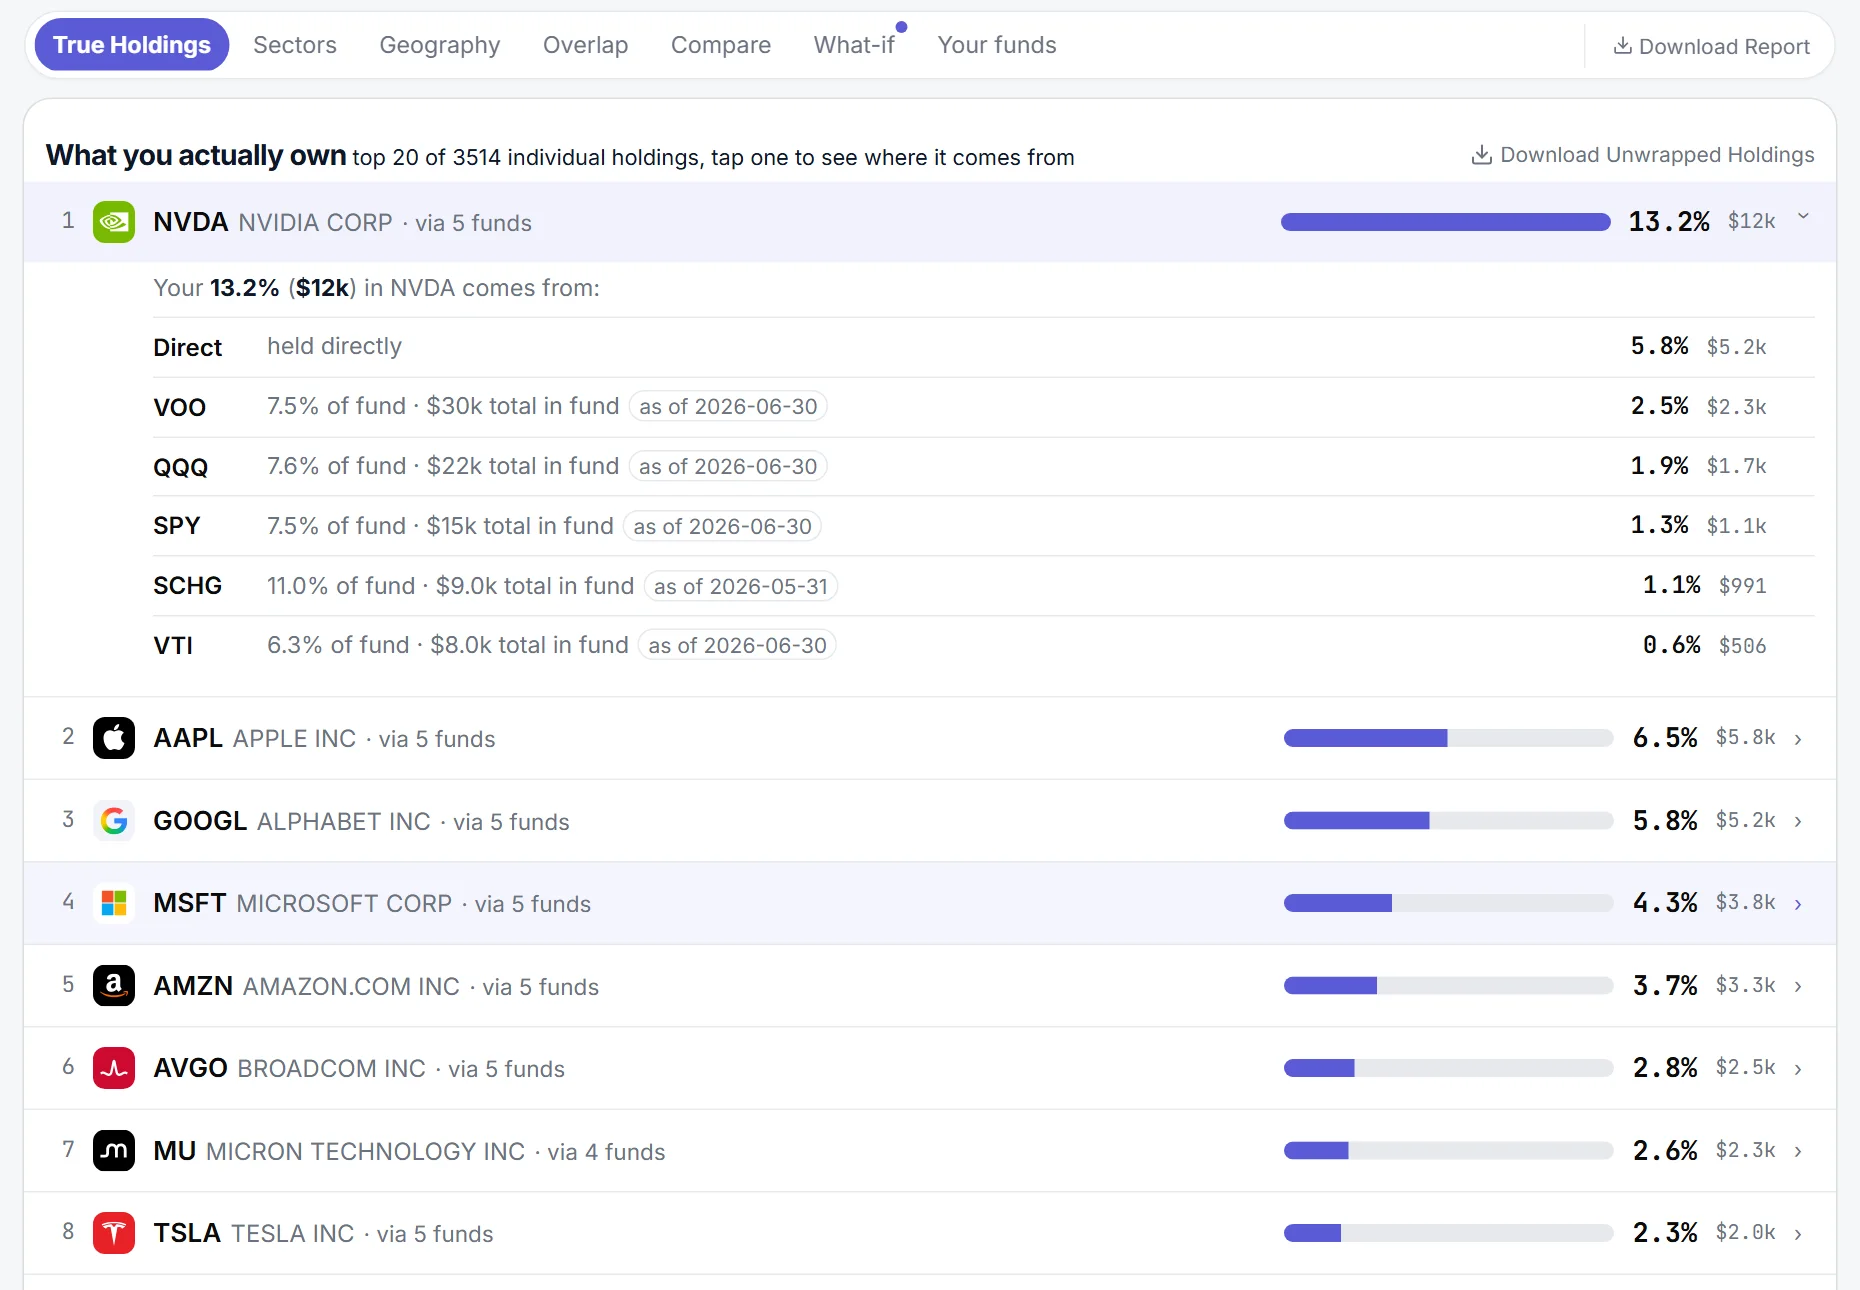
Every company you own after opening your funds, ranked by share of your portfolio. Click any row to see exactly which of your positions it comes from, including anything you hold directly. In the example below, NVIDIA is 13.2% of the portfolio, built from a direct holding plus slices of five funds. Use Download Unwrapped Holdings to export the full list as a CSV.
Sectors
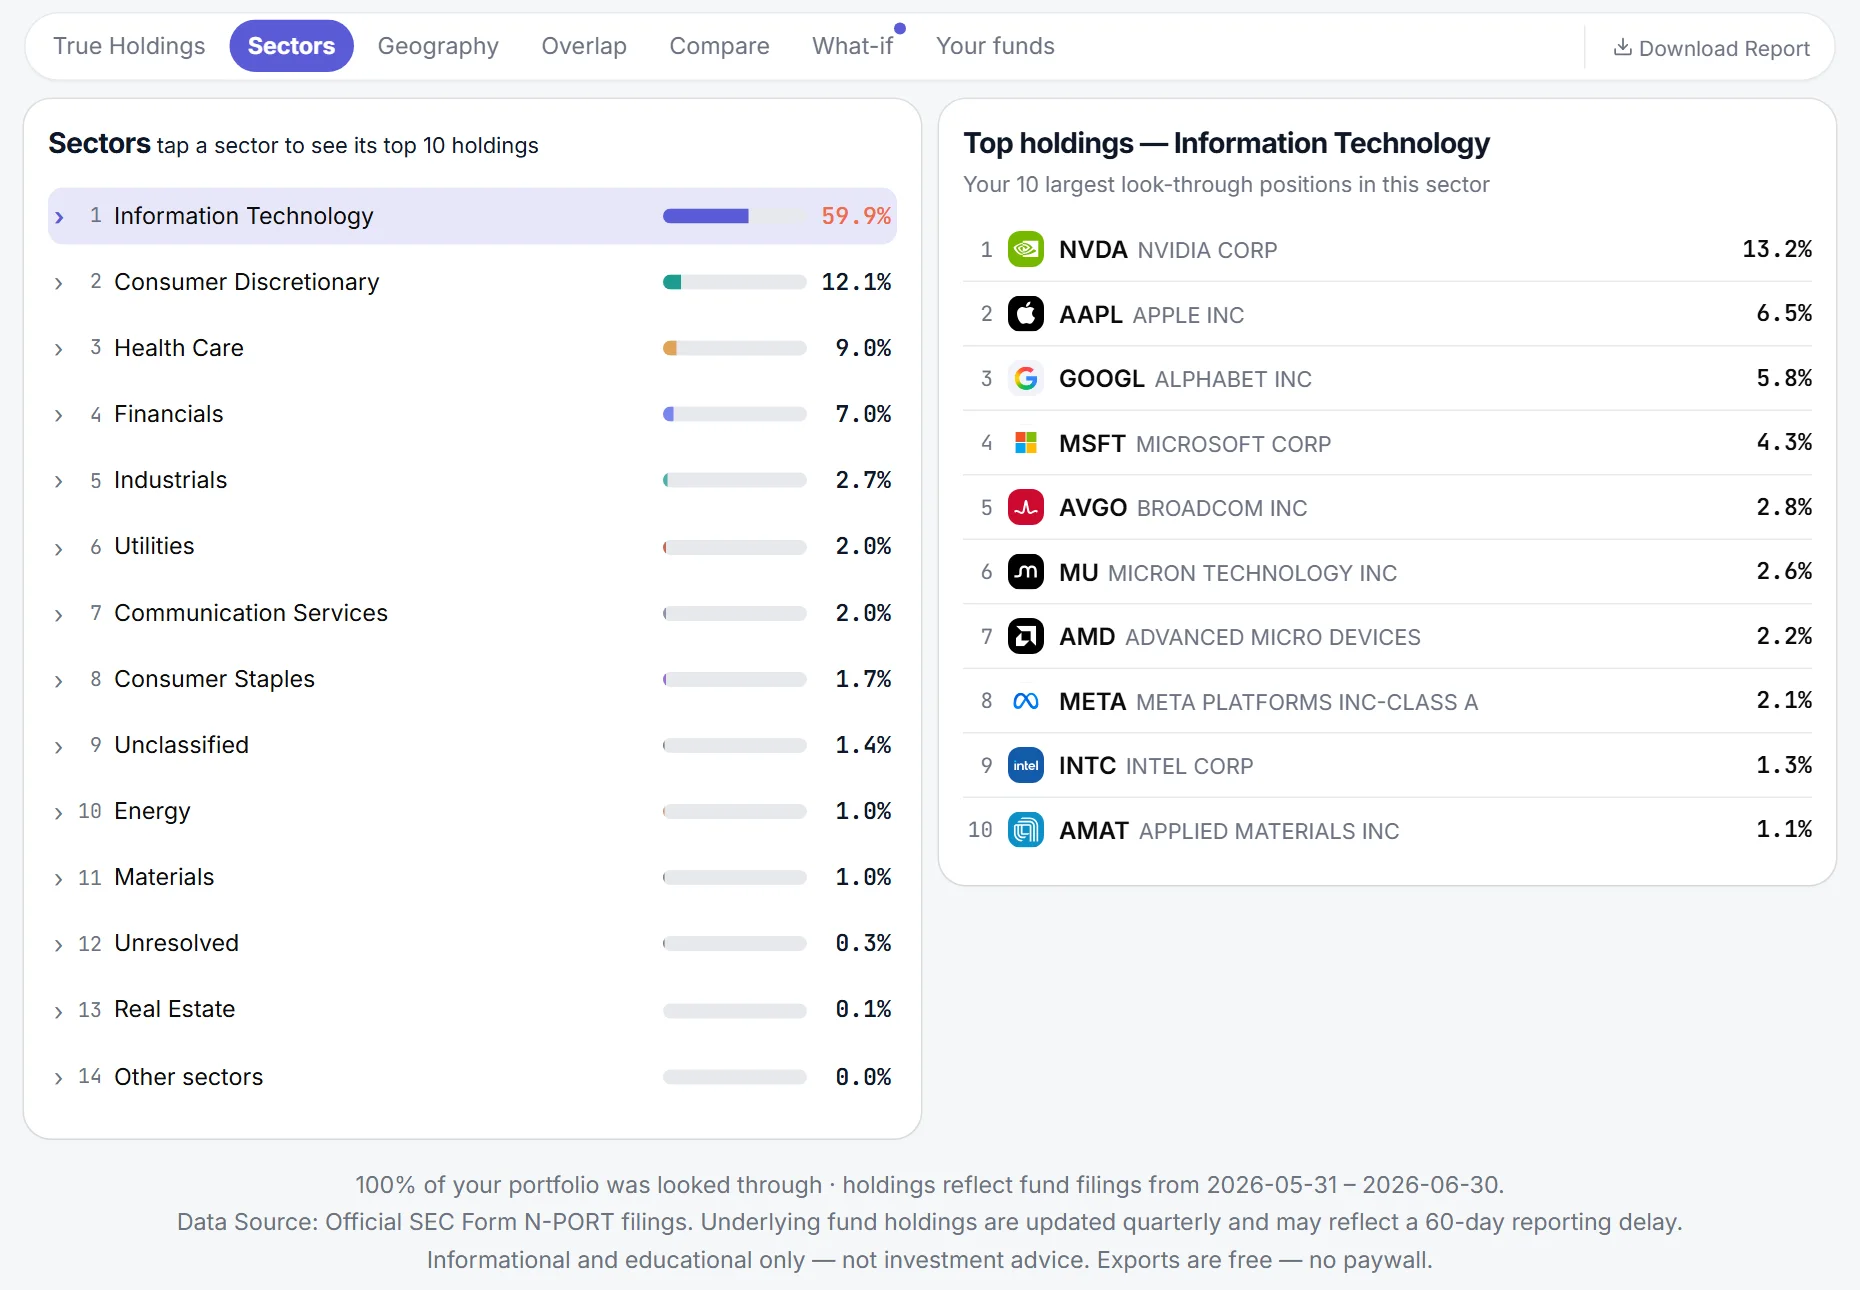
Your true sector mix across everything you own. Click a sector to see the ten biggest companies driving it.
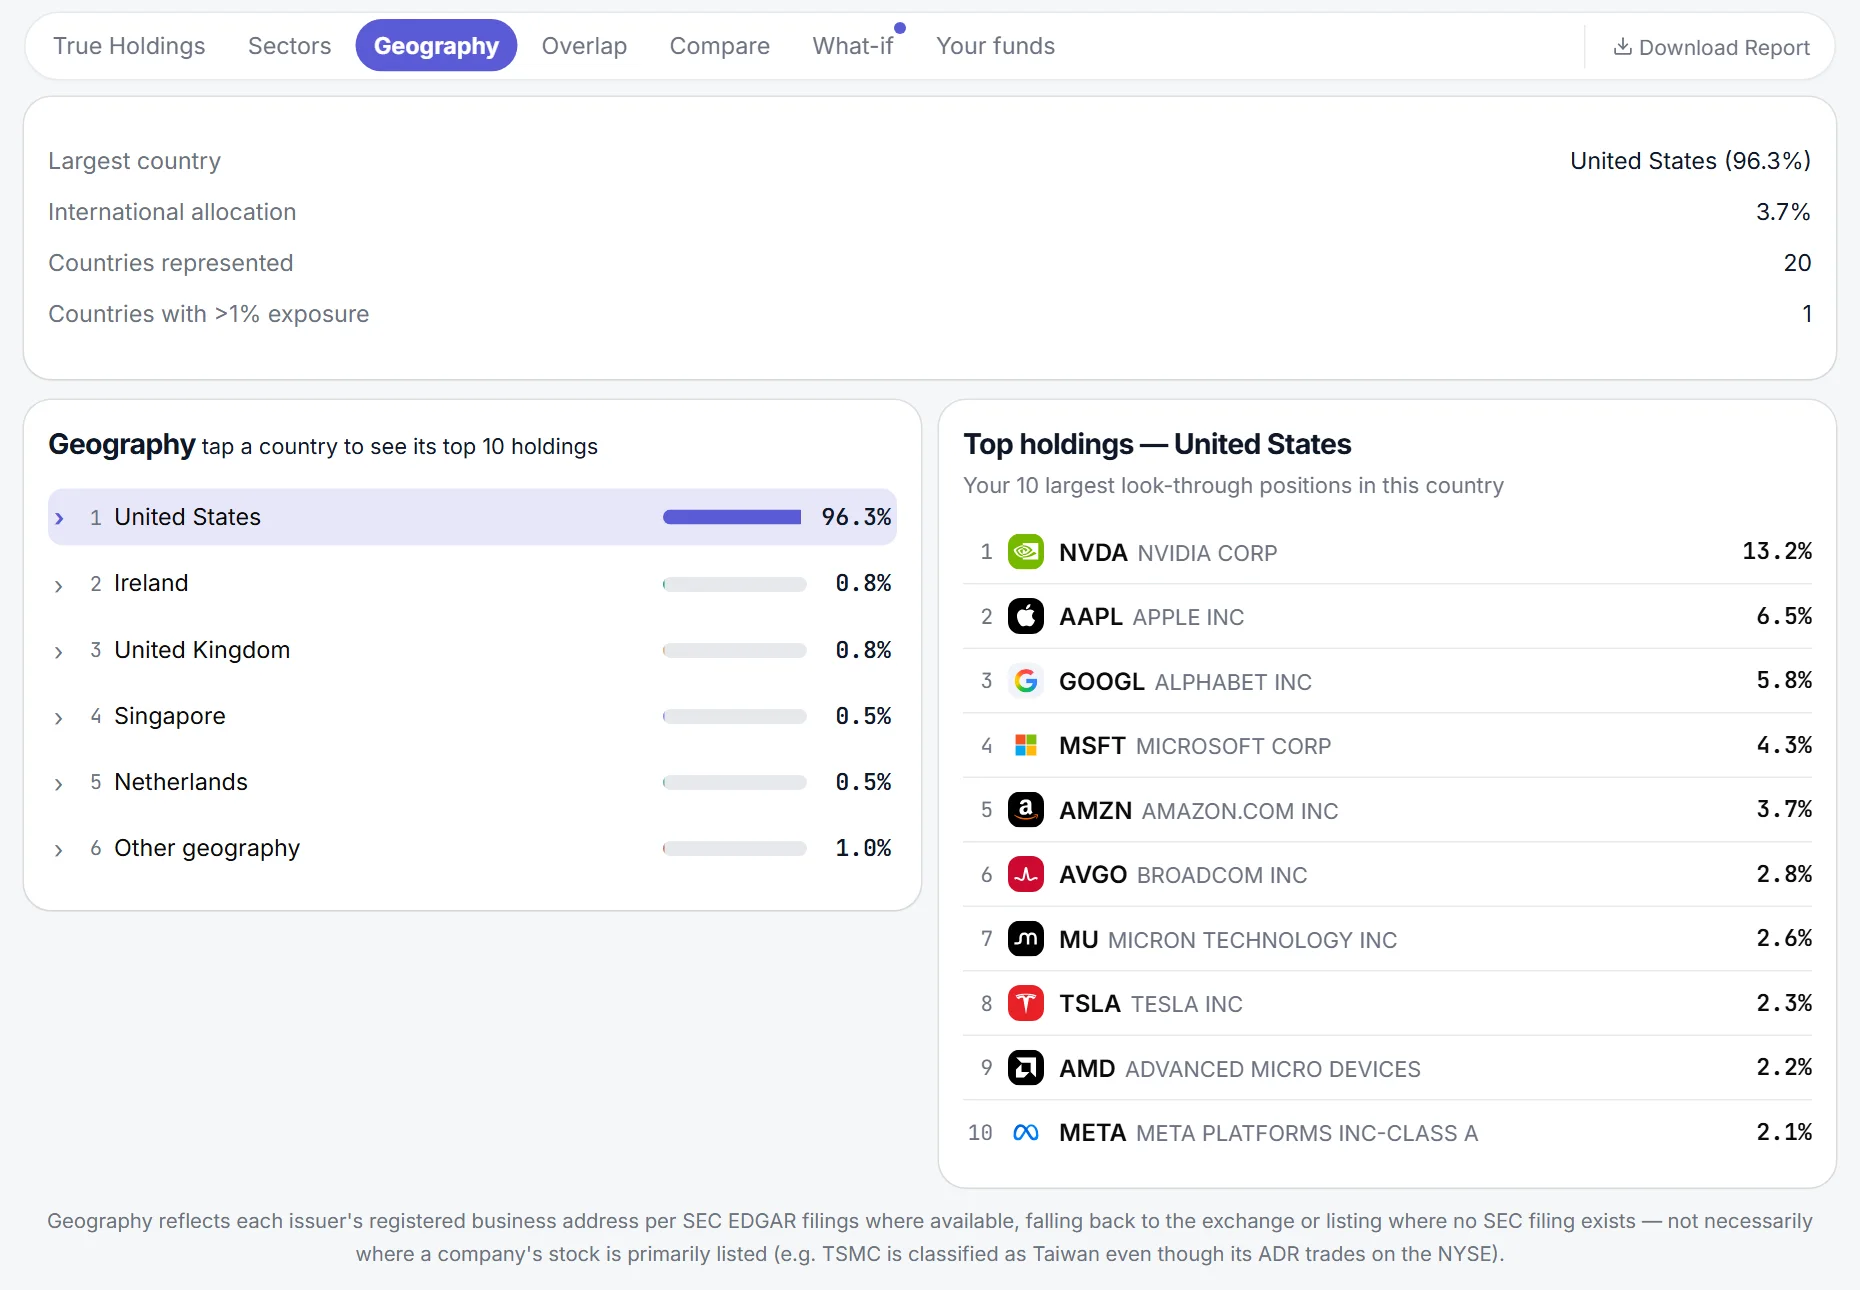
Geography
How much of your portfolio sits in the U.S. and elsewhere, with the same click-to-drill-down: click a country to see its ten biggest holdings. Countries come from each company's registered business address, which can differ from where its stock is listed.
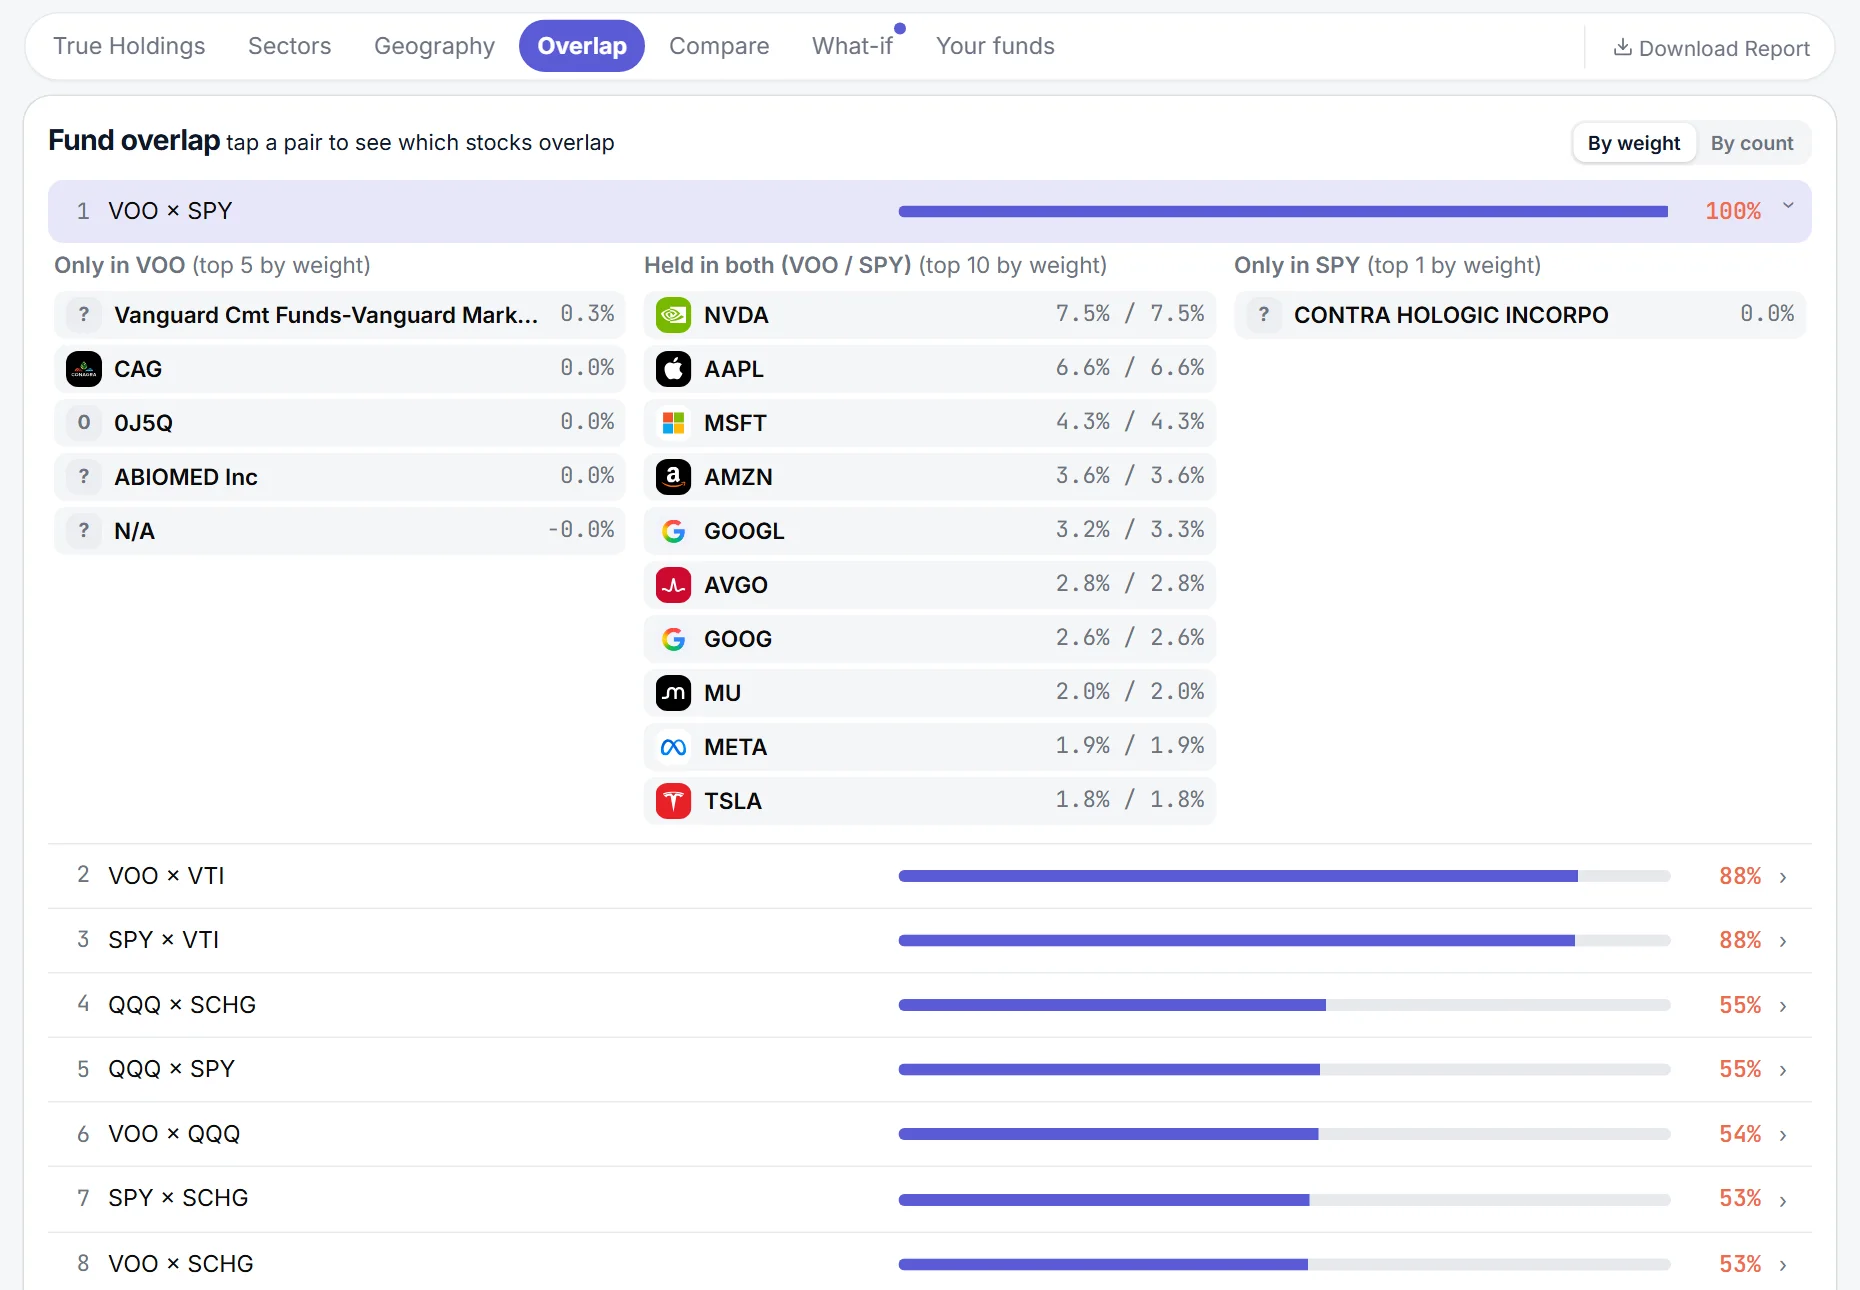
Overlap
Which of your funds duplicate each other. Pairs are ranked from most to least overlap. Click a pair to see what only one fund holds and what both hold, and switch between By weight and By count. High overlap means holding both adds little diversification.
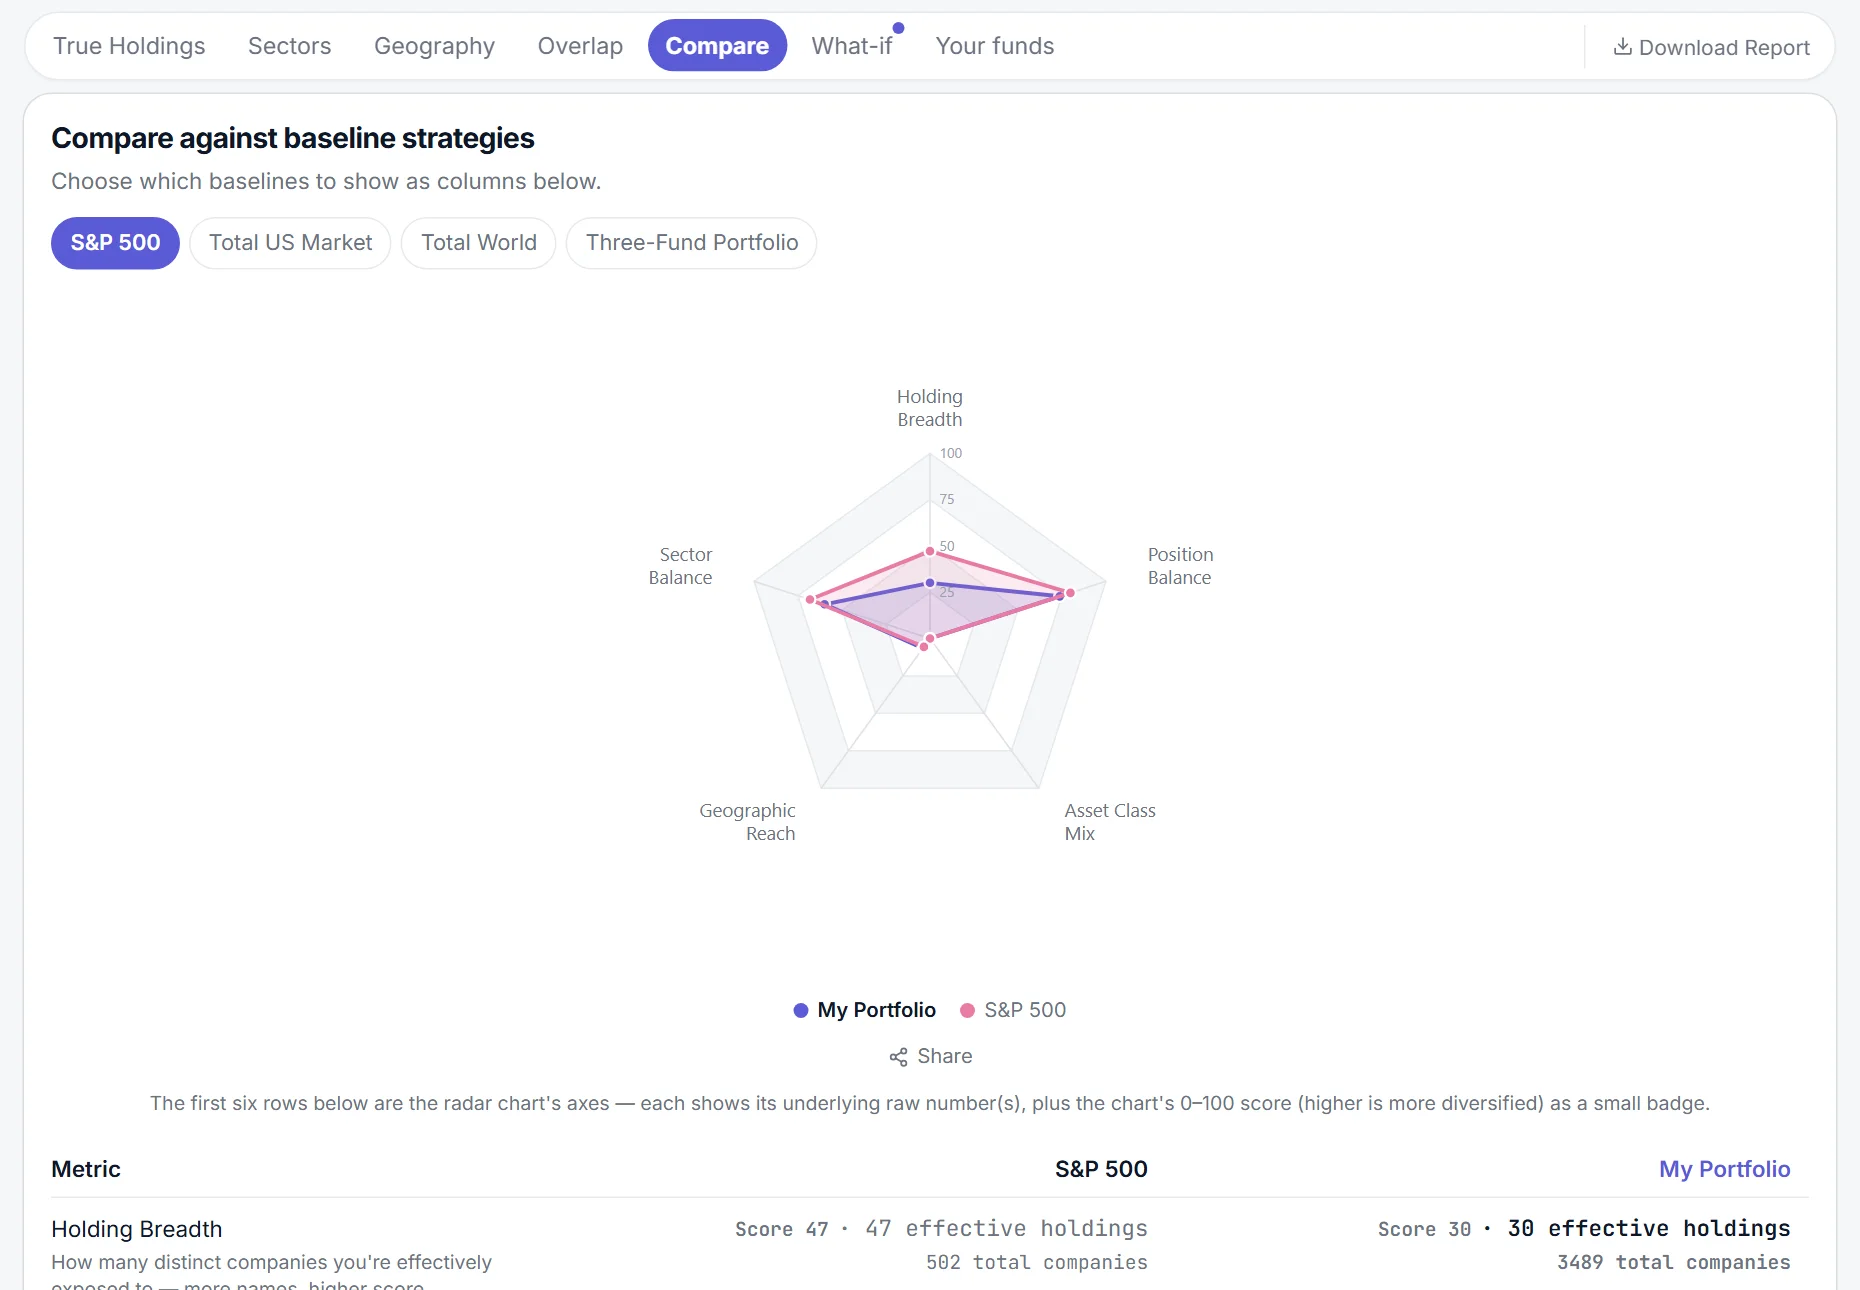
Compare
Measures your portfolio against a simple baseline: the S&P 500, the total U.S. market, the total world market or a classic three-fund portfolio. Pick a baseline with the buttons at the top. The radar chart and table score each one on holding breadth, position balance, asset class mix, geographic reach and sector balance.
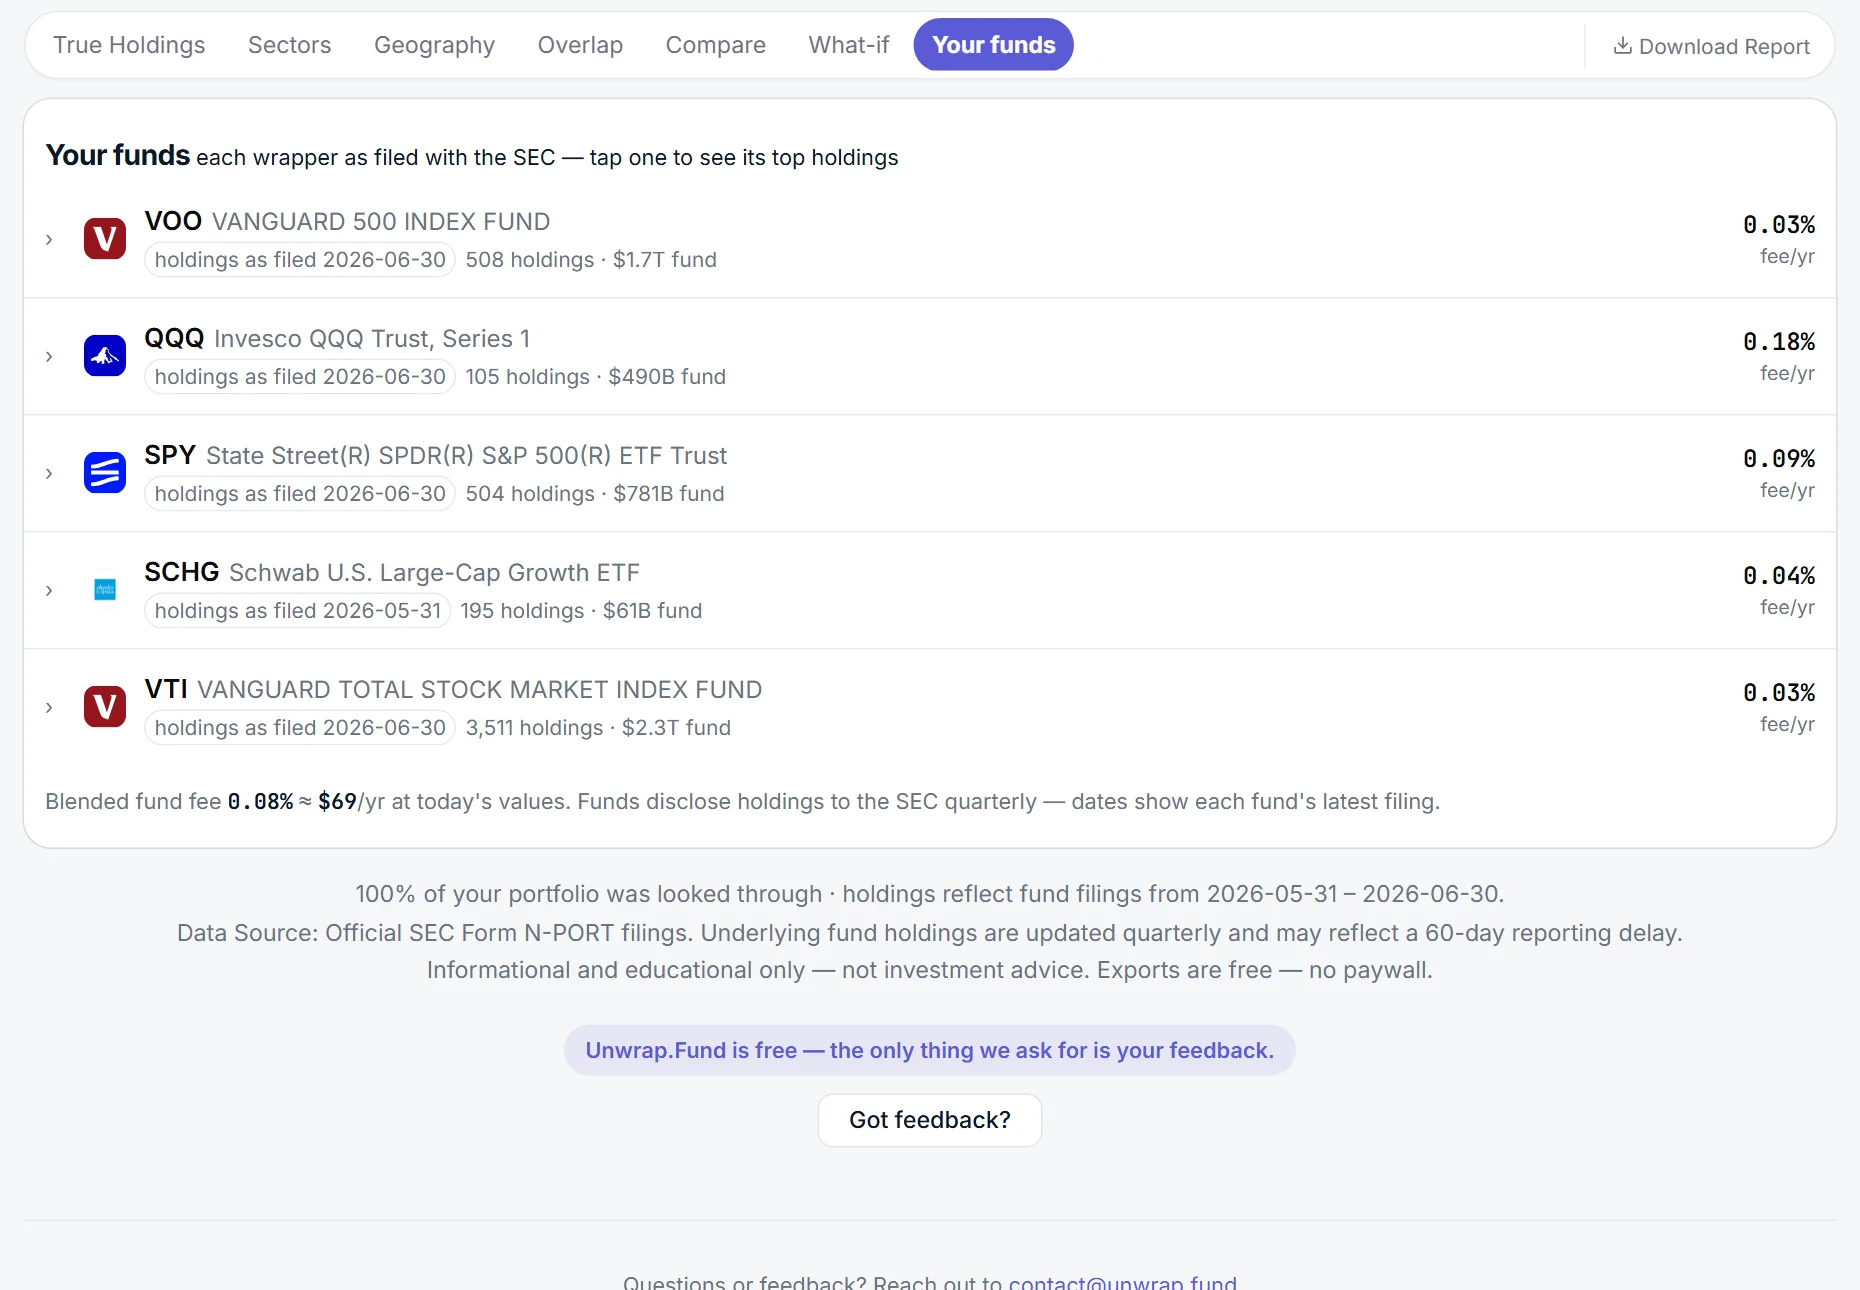
Your funds
One line per fund you entered: the date of the filing the data is based on, how many holdings it has, and its yearly fee. Click a fund to see its top holdings. The blended fee for the whole portfolio is at the bottom.
4. Try a what-if trade
Thinking of selling a fund or adding a new one? The What-if tab (“Try a Trade”) shows how that single trade would change what you own before you make it.
Click Add a sell and pick one of your holdings, or Add a buy for something new, enter a dollar amount, then click Simulate Trades. Use + Sell and + Buy to stack several trades.
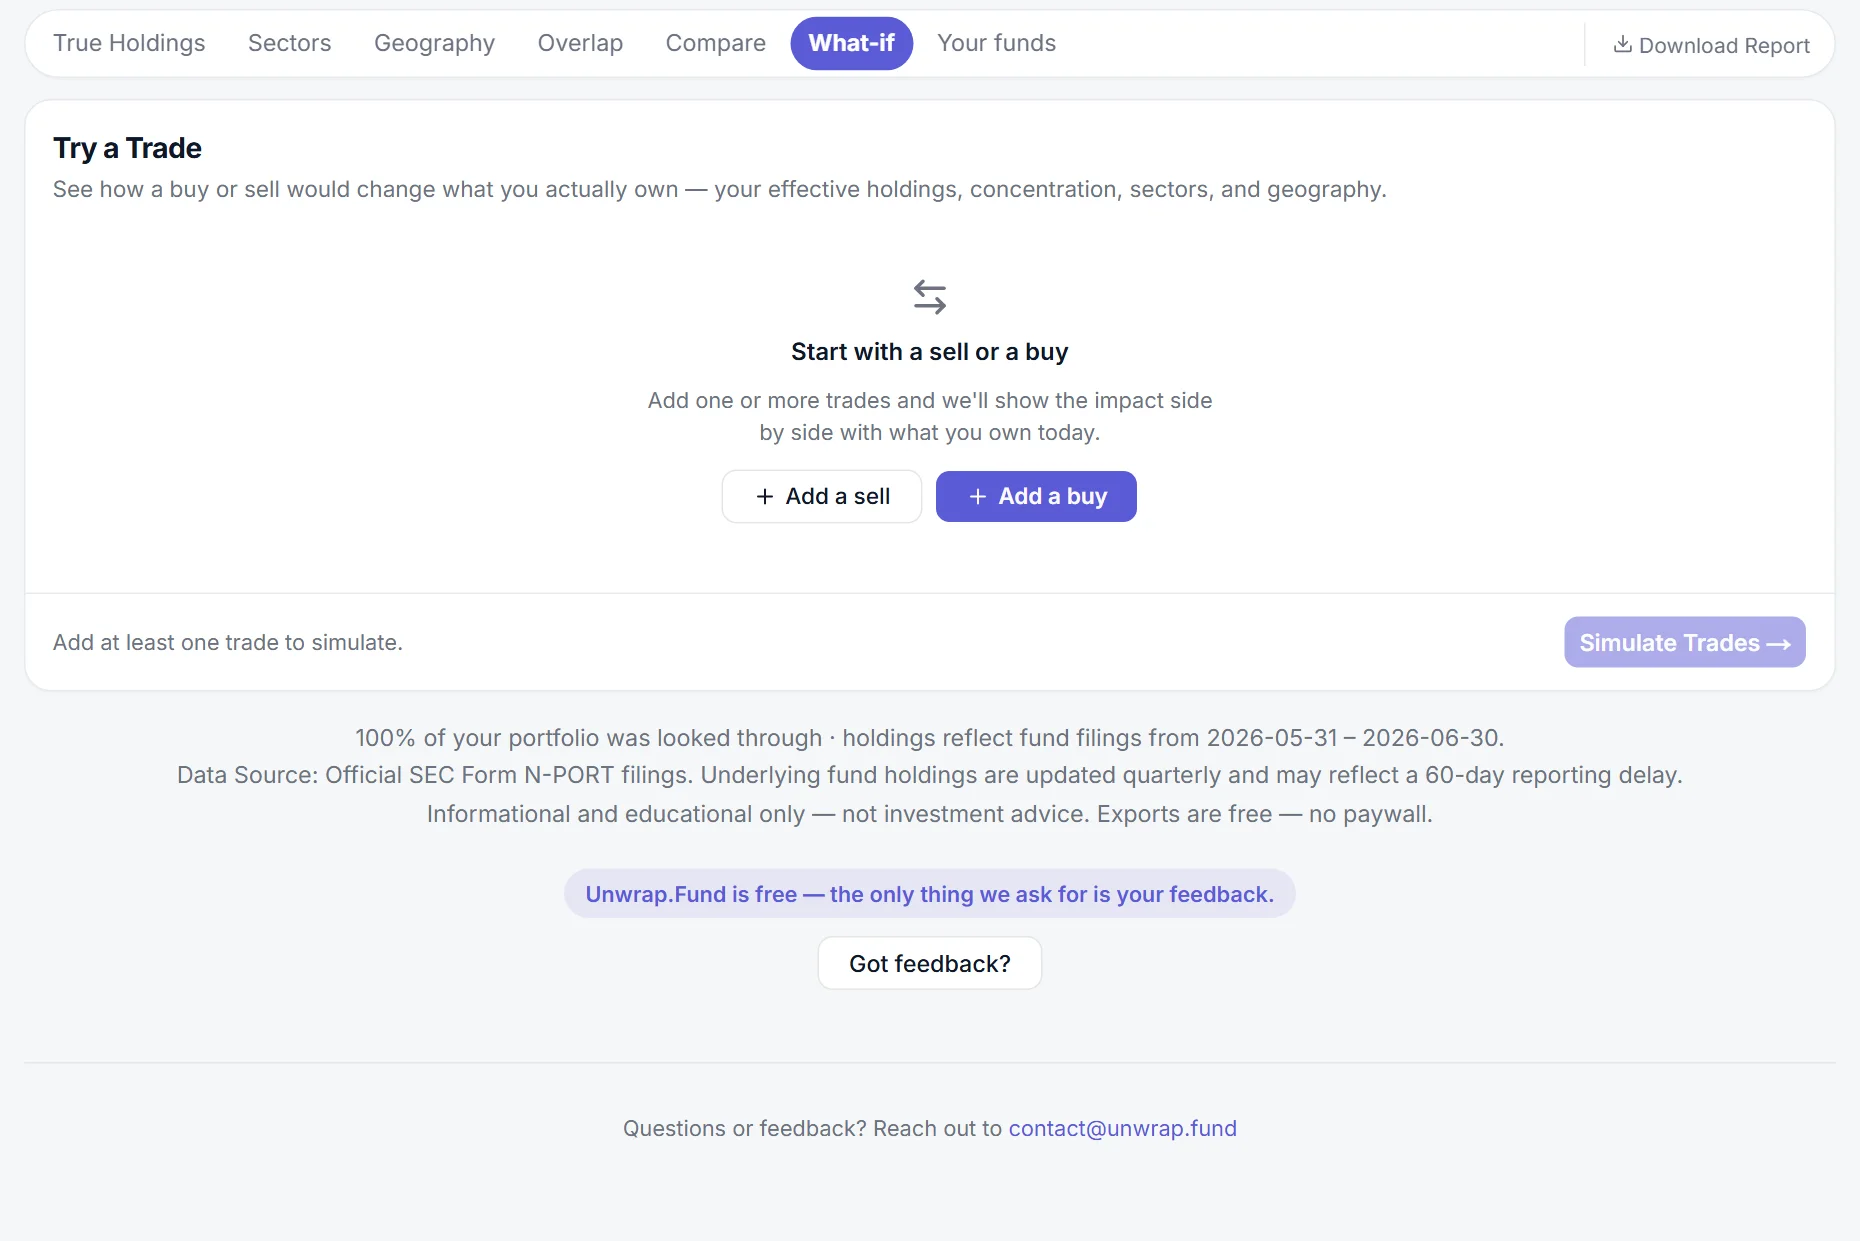
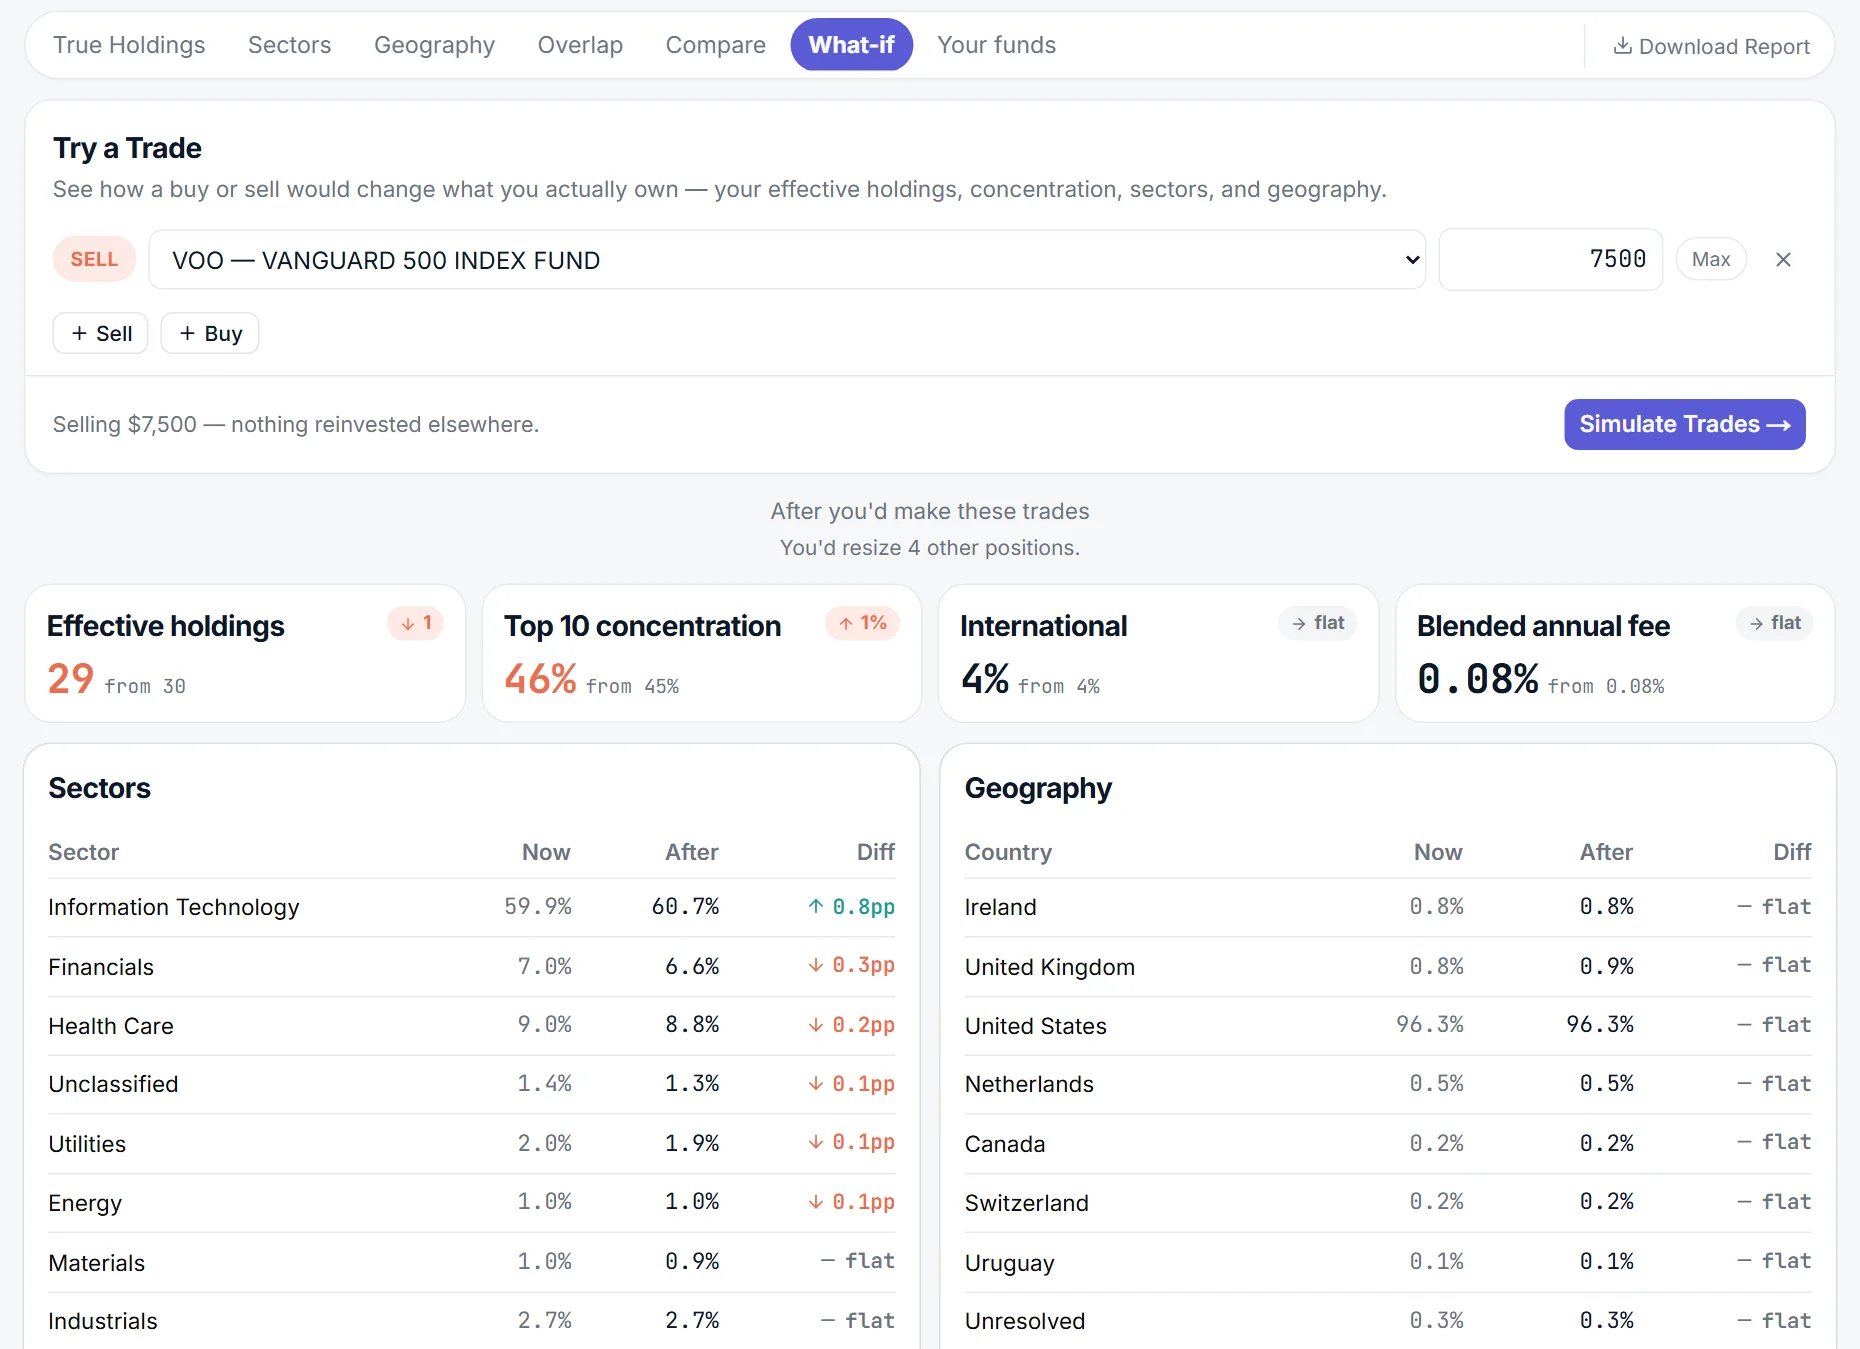
The result compares now with after: effective holdings, top-10 concentration, international share and fees, plus how every sector and country shifts. Nothing in your portfolio changes unless you click Apply these trades to my portfolio, which updates your list and re-runs the report. Click Clear to discard the trade.
5. Save, share and export
Once you've unwrapped, your list collapses into a summary bar. From there you can come back to it, send it on, or take the data with you.

- Edit portfolio reopens the list so you can change amounts or add positions, then Unwrap again.
- Copy Link copies a link with your whole portfolio in it. Open it later or send it to someone else and the same list loads.
- Start over clears the list and forgets the copy kept in your browser.
- Download Report (next to the tabs) saves the report as a PDF, and Download Unwrapped Holdings on the True Holdings tab saves every company as a CSV. Exports are free.
- Download Portfolio saves what you entered as a CSV you can upload next time instead of retyping.
Compare two funds, or look up a single fund
Just deciding between two funds? Compare two funds shows how much they overlap and which holdings they share. Type two tickers and click Compare.
To look at one fund on its own, click Explore a fund in the header of the tool to see its holdings, sectors and geography.
Frequently asked questions
Do I need an account to use Unwrap.Fund?
No. There is no signup or login. Open the tool, enter your holdings and press Unwrap.
Do I need to enter exact amounts?
Not exactly. Enter the dollar value of each position; approximate amounts still give a good picture, and the closer they are to your real holdings, the more accurate the percentages will be.
Which funds and stocks can I enter?
U.S.-listed stocks, ETFs and mutual funds that file Form N-PORT with the SEC. Non-U.S. funds (UCITS, European, Canadian) are not supported yet. A ticker that can't be identified is counted as a direct holding. Holdings come primarily from SEC N-PORT filings, which are quarterly with a delay. For some ETFs we also use fresher daily holdings from TickerInside (tickerinside.com) as a secondary source, and each fund page shows which source and date it uses.
Is my portfolio saved?
Not on our servers. It is kept in the page address and in your own browser, so you can bookmark the page or use Copy Link to come back to it or send it to someone.
Why does a fund take a moment the first time?
If Unwrap.Fund has not looked up a fund before, it fetches the latest filing from the SEC on the spot. Most take a few seconds; a few large funds can take a couple of minutes. You will see progress for each fund while you wait.
Why don't the numbers match what my broker shows?
Fund holdings come from quarterly SEC filings, which can lag by up to 60 days, so a fund's contents may be a few months old. Each report shows the filing dates it is based on.
Paste your positions, get your true stock exposure, overlap, and fees in seconds.